Turn your org chart into a strategic tool with org.manager
Powered by a fully automated process, Ingentis org.manager calculates personnel and company key figures and visualizes them – either within the org chart, as dashboard view or as a big data chart, thus providing you with helpful insights into business and workforce data. Be it to assess headcounts, vacancies, absences or budgets, be it to conduct diversity reports, demographic analyses, occupation ratios, or target-actual comparisons – Ingentis org.manager provides you with clearly organized HR reports based on org charts, diagrams and tables.
Aside from data drawn from a personnel management system like SAP HCM, information from other divisions such as Finance, Marketing or Production can also be used for successful workforce analytics. This way org charts become an effective strategy tool helping you to make the right decisions for your business.
Workforce analytics at a glance – Visualizing key performance figures
The integrated diagram function allows you to show performance figures, including occupancy rate, budget compliance and many others, as part of your organizational chart in a graphically-prepared format. There is a wide range of diagrams (e.g. bar chart, pie chart) to choose from. Finally, you won’t have to draw your diagrams yourself anymore!
Visualization rules – Highlighting what’s relevant!
Individually defined visualization rules allow you to determine how each organization unit, position or each employee are displayed based on arbitrary data.
For example, would you like to focus on all departments accross your organization where the vacant positions exceed the number of 3?
It just takes one click to highlight the objects of interest, based on color coding.
It’s also possible to bring your org charts to life with symbols and icons. Make use of the visualization rules and replace certain values with symbols, e.g. to point out first aiders or other special details of a person, position or org unit.
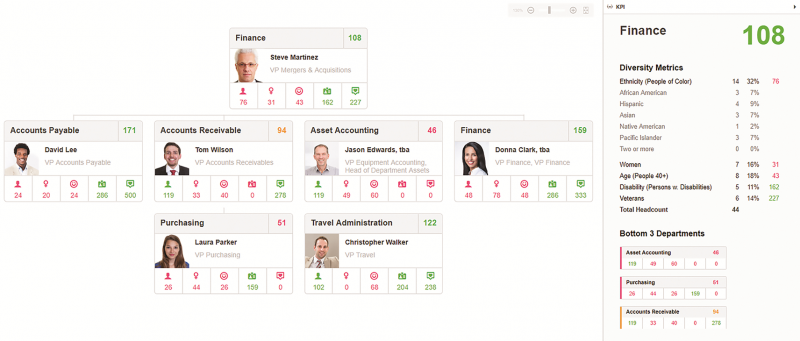
HR controlling via Big Data visualization
Did you know that it’s possible to present big data in a clean, compact way with the Ingentis org.manager tools? The software displays great amounts of HR data with the help of charts and diagrams such as the sunburst or the bubble chart. In addition, specific parts of these charts can be highlighted with the help of rules and filters.
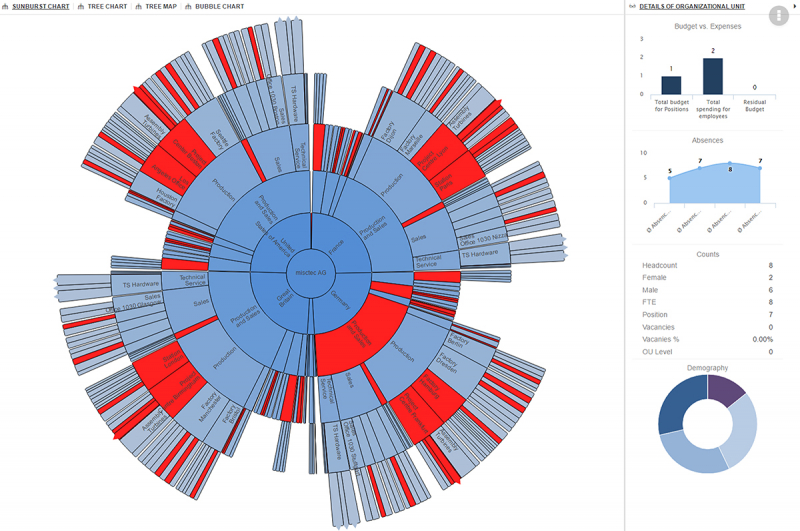
Use case: Diversity and inclusion management
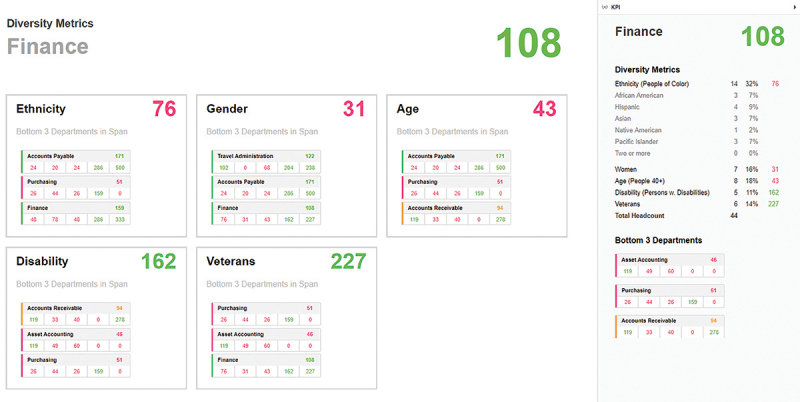
Diverse companies are more innovative, more dynamic, and more likely to attract top talent which helps them outperform other companies in the marketplace. But how can you efficiently manage diversity and inclusion in your company? How can you stay on top of the relevant facts and figures and know when it’s time to take action?
Thanks to its visualization features, Ingentis org.manager helps organizations measure the diversity supported across an entire organization, including the ability to identify those departments that are top performers when it comes to diversity as well as those departments lagging behind the most in promoting an inclusive workplace.
Our org charting software combines the five critical diversity measures ethnicity, age, gender, persons with disability, and veteran status, and provides an overall index score for each department to see how they rate for each measure, as well as an overall combined diversity index score that combines all five measures.
Use case: Analyzing open positions
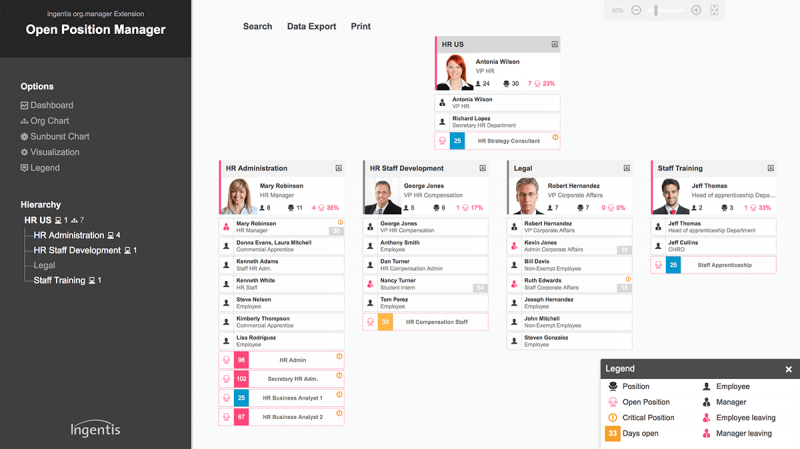
Whether an organization leverages position based management or person-to-person reporting, the importance of having visibility into vacancies across the organization along with KPIs to track critical areas of the organization is paramount. A key driver to successful workforce planning is understanding what open positions need to be filled and the time to fill metric for key positions.
Ingentis org.manager can help organizations to more effectively manage their vacancies with the help of KPI visualization. At a glance, you’ll understand where in your organization there are open positions, if they are critical and for how long they’ve been vacant. For example, key metrics for vacancy management can be visualized as part of your org chart or as a dashboard view.
Use case: Analysis for retirement eligibility
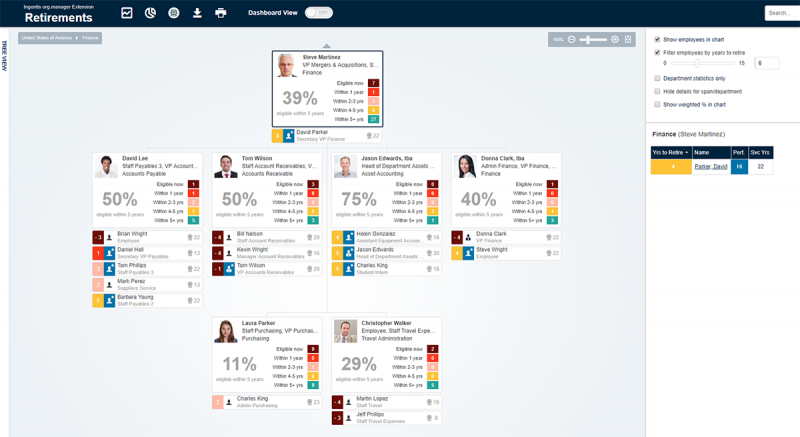
The visualization tools offered by Ingentis org.manager can also be used to calculate and visualize who in your company is eligible for retirement. For instance, if you look for employees that will retire within the next 6 years, move the respective slider back and forth to the right point in time to make them visible in the org chart. For better workforce planning, you could also highlight top performers and years of performance.
Here are some more examples of how to visualize KPIs in your org chart for your HR analytics report:
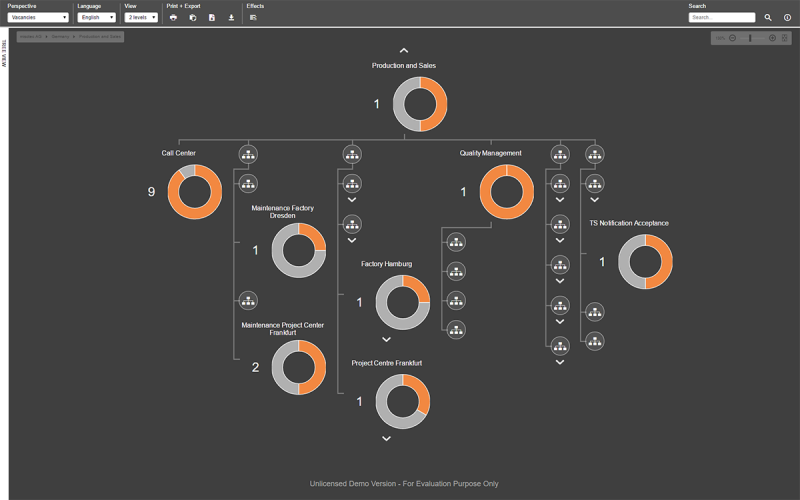
Ingentis org.manager vacancy visualization
Analyzing absences is one of the most important figure for executives and HR managers. Ingentis org.manager allows for a comprehensive overview that highlights trends and areas where action is required.
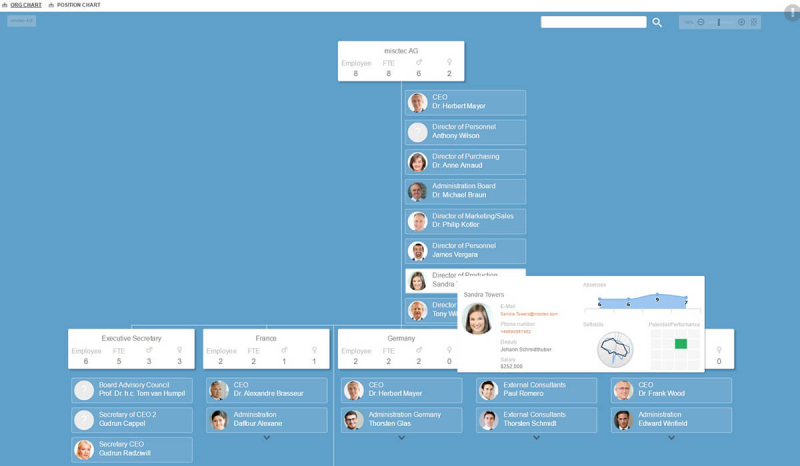
Ingentis org.manager FTE & headcount visualization
Ingentis org.manager calculates KPIs within seconds – be it for the complete organization, a single org unit, or for part of the hierarchy structure starting from a certain organizational level downwards.
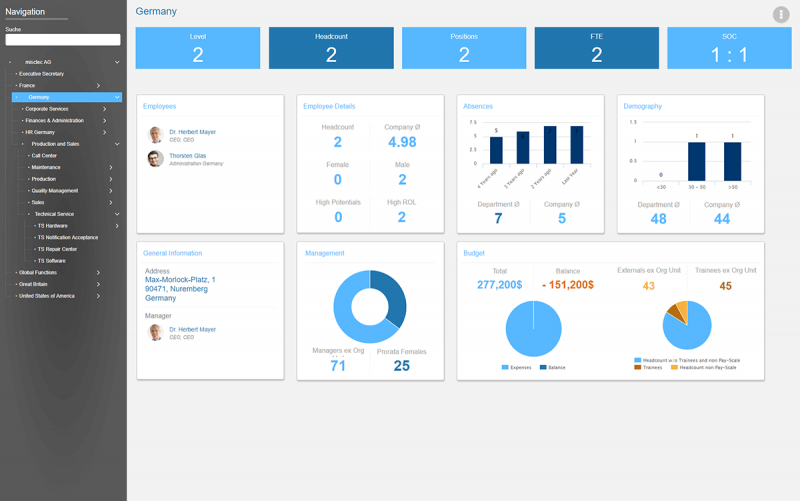
Ingentis org.manager dashboard
The customizable dashboard view of Ingentis org.manager displays typical KPIs such as gender distribution, demography and budget balance.
Check out the visualization of workforce data in our org.manager demo
Visit our org.manager demo to check out its rich feature list. There, you’ll also find several perspectives that illustrate how to visualize important KPIs for your organizational analyses and HR reports. For example, the perspective “Employee List” presents the org units together with their respective key figures such as headcount, percentage of vacancies or average age.
The perspective “Vacancies” visualizes an organizational structure that focuesses a single important key figure, vacancies.
To top it all off, the org.manager offers the perspectives ‘Dashboard’ and ‘Charts’ to illustrate very popular ways of displaying great amounts of data in a neat way.

Data warehouse org.manager
Regardless of the nature and number of systems you want to take and merge your data from, thanks to numerous standard interfaces Ingentis org.manager is a true ‘Data Warehouse‘. This means, that aside from data drawn from the personnel management system, information from other divisions such as finance, marketing or production can also be used.
Access protection for KPIs
The access protection add-on allows you to decide which information should be available to which employee via the web browser. The freely-selectable arrangement of content also permits the creation of a Management Cockpit or Dashboard. Vacation days, details for shift planning, overtime and absences or qualifications can be shown in a compact, up-to-date format. This allows you to easily create your own ESS/MSS portal.
Always up-to-date
When performing reorganizations, mergers or acquisitions, it is important to assess the impact of various possible hierarchy structure scenarios on the performance indicators. After the organizational structure is modified or values such as the personnel costs for a position are adapted, all KPIs are calculated based on the new constellation at the push of a button.
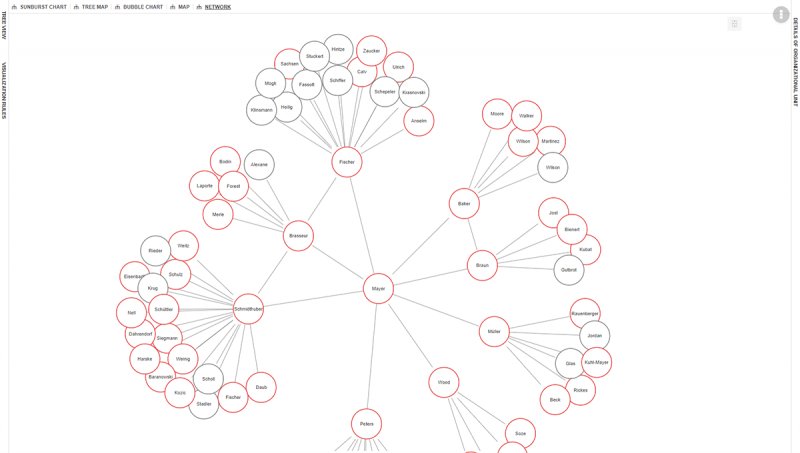
Network visualizations – Understanding who works together
A valuable structure to document is that of agile networks, such as project teams. These networks are typically temporary and comprised of employees from multiple departments. For example, a product launch would require employees from product development, marketing and sales to work together closely. A customized relation, illustrated as what we call a network visualization, could connect all team members, including the project team lead.
To avoid confusion, this network visualization would not be part of the default org chart but an additional view.
As a result, the default org chart would provide an overview of the legal structure while the network visualization shows how many project teams there are and who is part of them.
Highlights of HR controlling and HR analytics with org.manager
- Automatic calculation and updating of performance figures
- Use of diagrams and grids
- Results shown in the organizational chart in a clearly arranged format
- Flexible formatting options
- Extensive print and export functions
- Individually assessable access
Strategic organizational design: Bringing HR analytics and workforce planning together
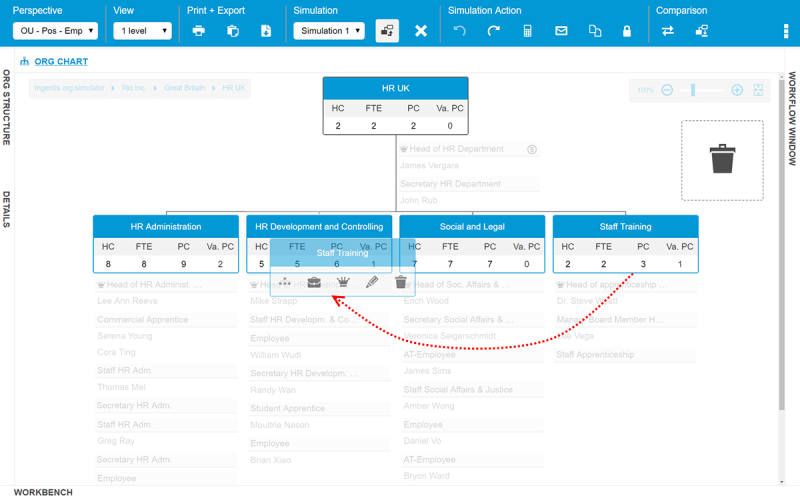
Ingentis org.manager not only displays the current state of your organization’s hierarchy, including key figure visualization, but is also the perfect solution when it comes to modeling the workforce of tomorrow. It doesn’t matter if your organizational transformation is triggered by an internal reorganization, a merger or an acquisition, it can easily be depicted with our org charting tool.
Feel free to plan several scenarios of what your future hierarchy structure could look like by creating new objects, deleting old ones or moving existing objects through the organogram via drag & drop. In order for you to know how great the impact of any change is, the related key performance indicators will adjust to the potential reorganization.